Distributed tracing
Follow one request from the load balancer to the last database write. Spans are stitched automatically across every service and protocol — no manual context passing.
span://hero
Tracewell follows each request across every service, queue, and database call — so when latency creeps or an error appears, you see exactly which hop caused it and when it started.
01# pip install tracewell02from tracewell import trace03 04trace.init(service="checkout-api")05 06@trace.route07def place_order(req):08 return db.orders.insert(req)span://product.console
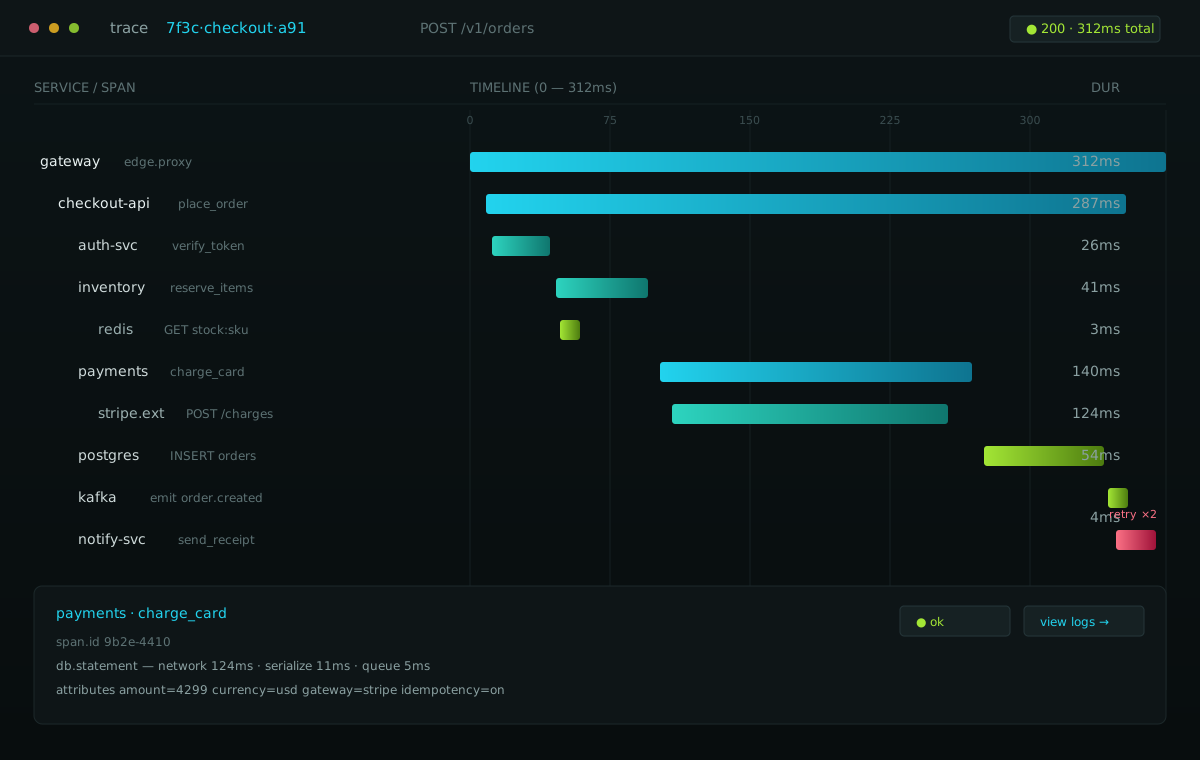
Click any slow request and Tracewell reconstructs its full path — every span, every query, every retry — so you stop guessing which service is to blame.
span://how-it-works
Drop in the SDK or point your existing OpenTelemetry exporter at Tracewell. One line of config per service, no agents to babysit.
Every request gets a trace ID that follows it across services, queues, and databases. Open any one and read its full waterfall.
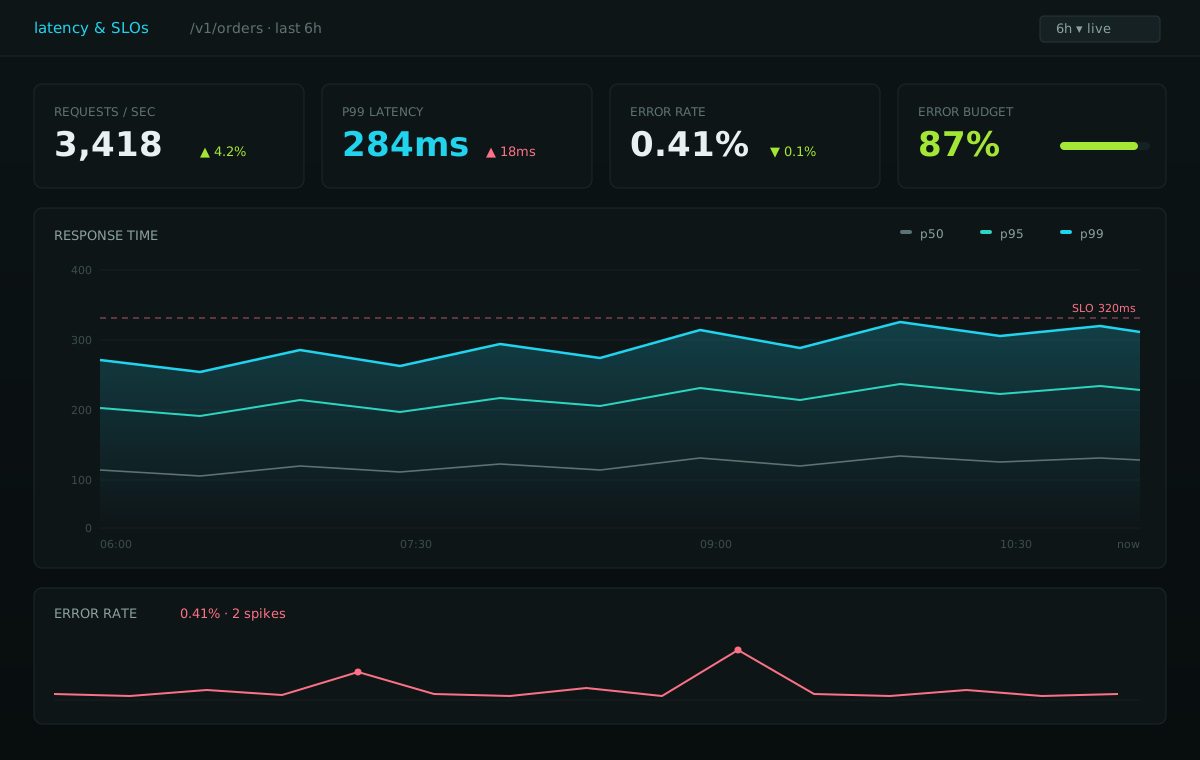
Set latency and error-rate SLOs in plain terms. Tracewell pages you the moment a service drifts — with the offending trace already attached.
Auto-instrumented across your stack
span://capabilities
Follow one request from the load balancer to the last database write. Spans are stitched automatically across every service and protocol — no manual context passing.
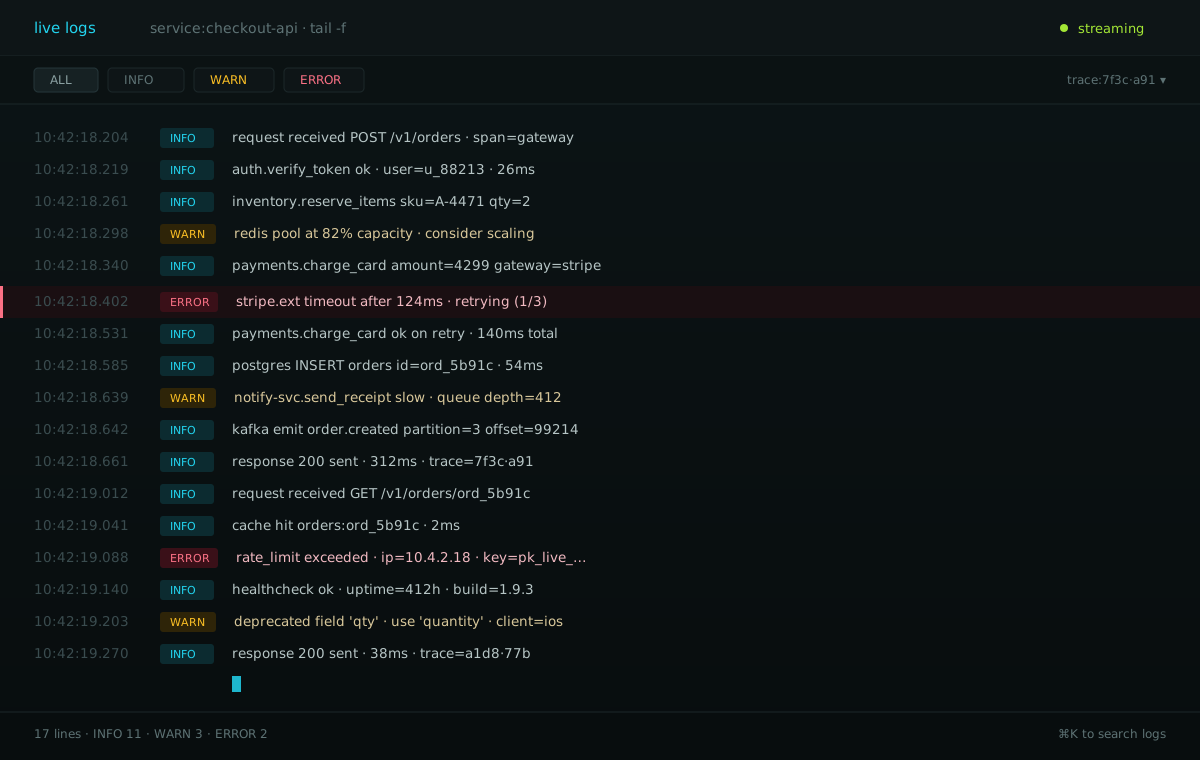
Exceptions are grouped by root cause and linked to the exact trace that threw them. See the stack, the inputs, and every downstream call that ran first.
Define p95 and p99 targets per endpoint and watch your error budget burn in real time. Tracewell forecasts the breach before your users feel it.
span://pricing
You only pay for the data you actually send. Scale a service to zero and your bill follows.
For side projects and getting a feel for tracing.
Start freeFor teams running real traffic in production.
Start 14-day trialFor org-wide observability with compliance needs.
Talk to usspan://get-started
Instrument your first service in six lines and watch the spans arrive in seconds. No credit card, no sales call.